


 |
Blood Pressure for Health |
For those who need to monitor their blood pressure and have a tensiometer, this application helps to keep a historical record of their blood pressure measurements, and also updates the iPhone app Health.
Blood pressure varies depending on the time of the day, for this reason the measurements are organized in three separate time series: Morning, Afternoon and Night.
This application is designed to keep a daily log of blood pressure measurements.
You can register separately the measurements taken in the morning, afternoon and evening. If a measurement result is outside of the range of normal values it will be highlighted in red color. The measurement results can be exported via email in HTML or CSV format so that they can be included in a spreadsheet. Data can be shown as a temporal graph which can be horizontally scrolled with your finger to the desired date. Interesting dates can be bookmarked for later view or statistical averages. So, for instance, you can bookmark the start and end date of a treatment, and check its effectiveness.
The application data can be integrated automatically with your iPhone’s Health Kit app.
Note: If you are already using the Blood Pressure app, when you install this new version the existing data will be preserved.
Requirements
This application requires IOS 8.0 and is available only for iPhone.
Language support
Currently only Spanish and English are supported.
The Spanish version of the app is called Tensión Arterial - Compatible con Health Kit.
Health Kit
This application is compatible with the iPhone Health Kit application.
This option is only available on iPhone and iOS 8 onwards.
The application can be used to feed information into your IPhone’s Health Kit app. In order to do this you must grant write access permissions for this app in Health Kit.

The first time you run the application a Health Kit screen is shown requesting to grant permissions to write the following data:
- Heart rate
- Diastolic blood pressure
- Systolic blood pressure
Once the above permissions are granted, a synchronization screen is shown.

When pressing the synch button all recorded measurements are exported to the Health Kit app. And from then on, all changes (new, modified or deleted measurements) are kept in sync with the Health Kit app.
If any of the required permissions is not granted on Health Kit or synchronization is not done, the measurements recorded are marked as pending synchronization to Health Kit. The synchronizationcan be done at any later time, from the Action button in the measurements list.
Note: Granting permissions to Apps is managed by Health Kit in the Fonts option. Before synchronization it is necessary that all three write permissions (heart rate, diastolic blood pressure andsystolic blood pressure) are granted.
Navigation
At the bottom of the screen there is a navigation bar that provides access to several options:
- Add - To enter new measurements.
- Measurements - To view the historical record of measurements.
- Statistics - To view the mean values
- Graphics - Graphical representation of the measurements.
- Bookmarks – Query bookmarks, or add new bookmarks.
Add
To add a new measurement you must enter the date of the measurement, the corresponding day period, the systolic and diastolic values, and the heart rate and then confirm.
When you enter this option the default values are taken from the current date/time and the last recorded measurement. Modify these values with your new measurement.

When you press the Store Measurement button the new measurement is added, and the Measurements screen is shown.
You can change date pressing Select date

Note: It is highly recommended to make several blood pressure measurements (2 or 3) and use the mean values.
Measurements
In this option you can view the measurement results for each day period (morning, afternoon, night). A selector allows you to choose the desired day period.
Results that lie within the normal blood pressure value range are shown in blue, those outside that range in red. This range can be changed in the Settings / Arterial Tension panel in your iPhone.

The action button in the upper right corner  is used to import/export the data.
When you press it a menu is shown with six options:
- Delete measurements
- Sync Health App
- Send CSV by email
- Send HTML by email
- Send PDF by email
- Back Up
- Import data

1 - Delete measurements.
This allows you to delete an entire series.

You can select each series individually
2 - Sync Health App
Synchronization with Health Kit allows you to export pending (unsynchronized) data to Health Kit.

Note: If the App is already authorized in Health Kit, the new measurement results will be automatically updated in Health Kit. If the authorization is removed, new measurements will be marked as ‘pending synchronization’, and can be exported later when the authorization is granted again.
3 - Send CSV by email
It Sends measurements of the selected series in CSV format (comma separated values) by email
The data is sent to a file in CSV format that can be opened with a spreadsheet. The file can be imported into the app.

 bp
bp
4 - Send HTML by mail
 bp
bp
5 - Send PDF by mail
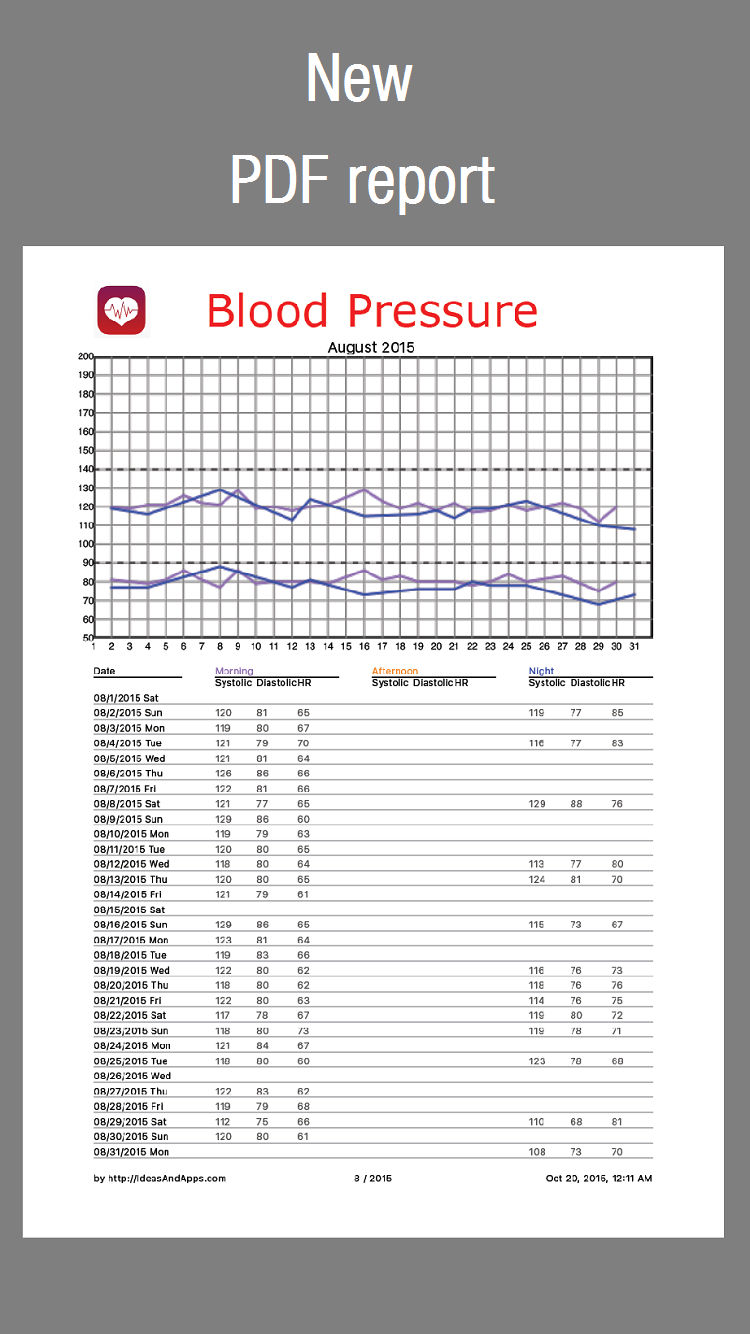 bp
bp6 - Back Up

7 - Import data
With this option you can add to the database measures contained in CSV files located in the documents directory.


The measurement will be added to database.
You can see the contents of the file by touching on View data button.

You could create/update Excel .csv files which could have unlimited lines and 5 columns.
Lines with measures must be preceded by a header line. (Lines before heather are ignored)
Heather
"Date;Series;Systolic;Diastolic:HR"
Columns:
- Date - dd/mm/yyyy or mm/dd/yyyy format
- Series name - ("Morning" - "Afternoon" - "Night")
- Systolic value - integer value
- Diaslolic value - integer value
- Heart rate - integer value
Statistics
Within this option you can view the average values for systolic/diastolic blood pressure and heart rate for a selected day period (morning, afternoon, night) and date range.
A selector allows you to change the day period.
Average values can be viewed for the measurements taken within:
- last day
- last 7 days
- last 30 days
- last 90 days
- last 180 days
- last 365 days
- all

as well as the total number of measurements for the given date period, and the number of measurements that lied outside the normal value ranges (#Hyper samples).
You can see data on a piechart by touching on a period

Graphics
Within this option the measurement results are represented in a graph that can be displaced with the finger from the oldest to the most current measurement (left to right). When displacing the graph the measurement values for all three day periods (morning, afternoon, night) for the corresponding date are shown.
The measurements are displayed as dots joined by lines on top of two colored stripes that represent the range of normal values. These ranges can be changed in the Settings / Blood Pressure panel in your iPhone.

Each day period is represented by a different color. The graph for a given day period can be hidden or made visible by clicking on its name.
Bookmarks are shown in the graph as vertical lines with their corresponding text.
Bookmarks
You can bookmark a particular day in the graph with an explanatory text. This can be useful to show in the graph some change in our daily habits or our medication.


A list containing all defined bookmarks is shown. A bookmark can be deleted by swiping your finger from right to left on it and confirming.You can add new bookmarks by touching the  button in the upper right corner.
You can see statistical data piechart by touching on a bookmark

You can see data on a piechart by touching on a period

Backing up data
The application back Up files are stored in the application documents directory, which can be saved on your computer’s disk (if you want to make a backup), deleted (if you want to delete all the information) or overwritten (if you want to restore a previous backup).

You will need iTunes to access these data files. Connect the iPhone/iPad to your computer, open iTunes, go to the device’s applications tab and search ‘Blood Pressure’ (found in the "File Sharing" window). When you select the ‘Blood Pressure’ app, the "Blood Pressure Documents" window will be displayed on the right.
Alternatively you could send csv file attached with e-mail. When you open attached file it will copy itself into this application.