


 |
AGR Blood Pressure log
|
For those who need a follow up of their blood pressure and have a blood pressure meter, this app will help them to keep a record of their measurements.
Blood pressure varies depending on the time of day, for this reason the measures are organized in three separate series: Morning, Noon and Night.
Requirements
This app requires IOS 6.1 or higher and it is available for iPhone and iPad.
Idiomas
Holds languages Spanish and English.
The Spanish version is named "Tensión Arterial".
Navigation
In the bottom there is a navegation bar that Will take you to the next options:
- Add -To add new measures.
- Measurements- To consult the historical record of measures.
- Stats- To consult average values.
- Graph- Graphical representation of the measures.
- Bookmark- To consult and add the bookmarkers.
Add
To add a new measurement you should choose the date you take the measurement, the series it belongs to, the SYSTOLIC and DIASTOLIC values, the cardiac rate and confirm.
When you enter this option the date is automatically set. A series corresponding to the hour is shown, as well as the values of the SYSTOLIC (highest), DIASTOLIC (lower) and pulse.

The date may be changed touching the key Select date.

Once the series and the values we want have been chosen, touch the key Store measurement. This way the measurements are recorded and it jumps to the measurements screen.
Nota: it is recommended to take various measurements (2 or 3) and use as final value the average value.
Measurements
Here you may consult the measurements in each series. There is a selector that allows to see the series of measurements we want.
The values that are within the normal range for blood pressure are shown in blue color, while the measurements out of the normal range are shown in red color.
This range may be modified in the Settings / BP log in the iPhone or iPad.
.png)
The action button in the upper right corner  is used to import/export the data.
When you press it a menu is shown with six options:
- Delete measurements
- Send CSV by email
- Send HTML by email
- Send PDF by email
- Back Up
- Import data
1 - Delete measurements.
This allows you to delete an entire series.

You can select each series individually
2 - Send CSV by email
The data is sent to a file in CSV format that can be opened with a spreadsheet. The file can be imported into the app.


3 - Send HTML by mail

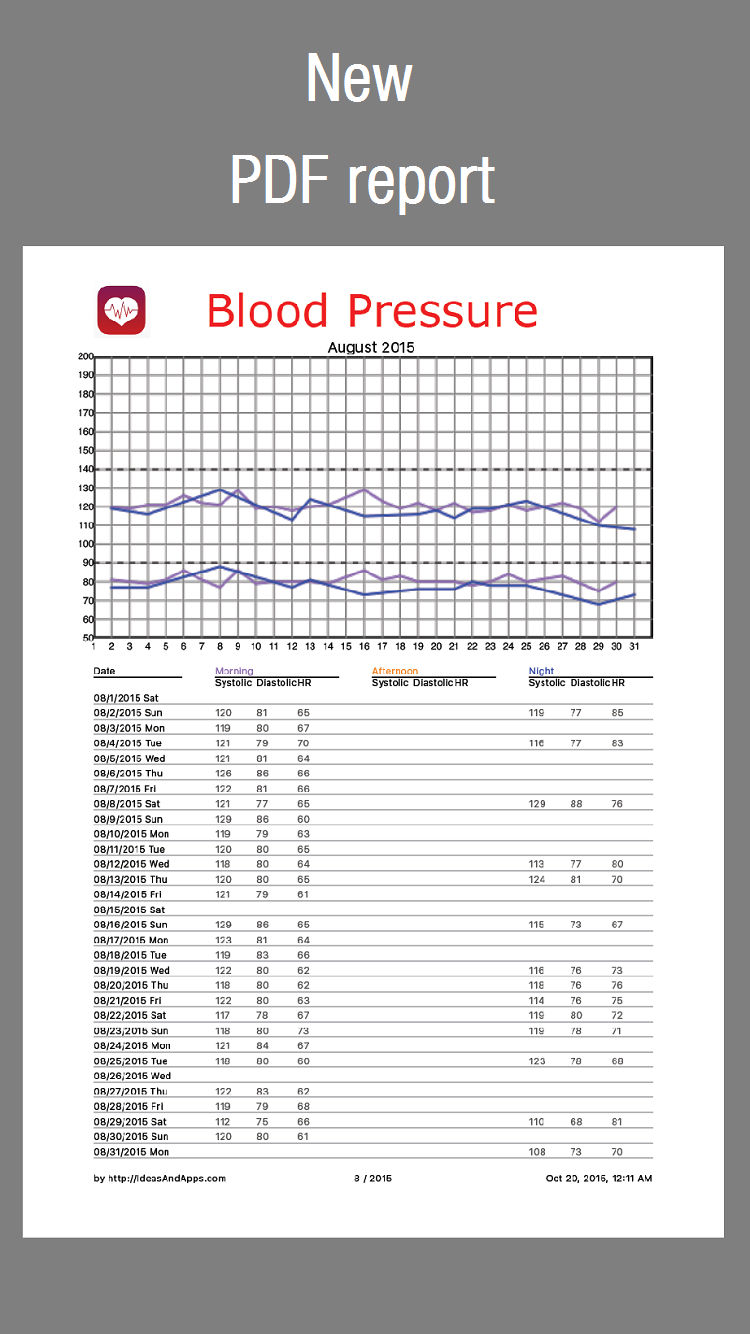
4 - Send PDF by mail
5 - Back Up

6 - Import data
With this option you can add to the database measures contained in CSV files located in the documents directory.


The measurement will be added to database.
You can see the contents of the file by touching on View data button.

You could create/update Excel .csv files which could have unlimited lines and 5 columns.
Lines with measures must be preceded by a header line. (Lines before heather are ignored)
Heather
"Date;Series;Systolic;Diastolic:HR"
Columns:
- Date - dd/mm/yyyy or mm/dd/yyyy format
- Series name - ("Morning" - "Afternoon" - "Night")
- Systolic value - integer value
- Diaslolic value - integer value
- Heart rate - integer value
Stats
In this option the average values of blood pressure, systolic, diastolic and pulse may be consulted.
The average values are calculated for the following groups of measurements:
- Measurement recorded the last day
- Measurements recorded in the past 7 days
- Measurements recorded in the past 30 days
- Measurements recorded in the past 90 day
- Measurements recorded in the past 180 days
- Measurements recorded in the past 365 days
- All measurements

Other values shown are the number of measurements recorded in each group and how many of them are out of the normal blood pressure range.
You can see data on a piechart by touching on a period

Graph
In this option the data is showed on a graph that may be moved sliding the finger on the screen from the oldest measurement to the current one. When moving on the graph the values of the three series will be showed for the corresponding date.
The measurements are showed as a graph of dots connected by lines over two colored band representing the range of normal blood pressure. This range may be changes in settings / Blood pressure in the iPhone / iPad.
.png)

Each series is represented in a different color. The graphs may be hidden or turned visible when touching on their name.
With the << and >> buttons you can go to the beginning or end of the graph respectively.
In the graph the markers we have add, as vertical lines with its corresponding notes, is also shown.
Bookmarks
Markers allow to sign on the graph on a chosen day and add a note. This is useful to mark the beginning of a treatment with a new medication, or the start of new daily habits.
A list of all the bookmarks we have created is shown.
A Bookmark may be removed sliding the finger from right to left on top of it and confirming.
The graph indicates that day with a vertical line and the corresponding text.
.png)
For example when you click on the second "indapamina" bookmark corresponding to the measurements made between 10/06/2014 and 01/10/2014 (this is the date of a new "enalapril" marker) will display statistics.
.png)
New markers may be added touching the key  in the superior right corner

You can see data on a piechart by touching on a period

compatibility with Health Kit
There are a A version of this app which is compatible with the iPhone app Health (Health Kit):
Blood Pressure for Health (only for iPhone with IOS 8.0 or higher)
Backing up data
The application back Up files are stored in the application documents directory, which can be saved on your computer’s disk (if you want to make a backup), deleted (if you want to delete all the information) or overwritten (if you want to restore a previous backup).

You will need iTunes to access these data files. Connect the iPhone/iPad to your computer, open iTunes, go to the device’s applications tab and search ‘Blood Pressure’ (found in the "File Sharing" window). When you select the ‘Blood Pressure’ app, the "Blood Pressure Documents" window will be displayed on the right.
Alternatively you could send csv file attached with e-mail. When you open attached file it will copy itself into this application.